Nuclear Magnetic Resonance
Nuclear magnetic resonance (NMR) is one of the most useful analytical methods in modern chemistry. It is used to determine the structure of new natural and synthetic compounds, the purity of compounds, and the course of a chemical reaction as well as the association of compounds in solution that might lead to chemical reactions. Although many different kinds of nuclei will produce a spectrum, hydrogen (H) nuclei historically have been the ones most studied. NMR spectroscopy is particularly useful in the study of organic molecules because these usually incorporate a large number of hydrogen atoms.
NMR Spectrometers
While the original NMR spectrometers were built to scan either the frequency or the magnetic field, the usual procedure is to use Fourier transform spectroscopy (FT NMR). The protocol for obtaining a FT NMR spectrum is to place a solution of the compound to be studied in a homogenous magnetic field and irradiate it with a short pulse of the appropriate radio-frequency. The shortness of the radio-frequency pulse results in a band of frequencies that simultaneously radiate all of the nuclei of a particular type to be studied. Each magnetic nucleus that absorbs this radio-frequency energy will then radiate radio-frequency energy at a very specific frequency. The frequencies generated by the various nuclei are then detected, Fourier transformed, and displayed as a plot of frequency versus intensity. This plot is called an NMR spectrum. The frequency at which magnetic resonance occurs depends on the strength of the magnetic field used and on the nucleus to be studied. The stronger the magnetic field used the higher the resonance frequency, the greater the dispersion (separation) of the bands, and the greater the sensitivity of the experiment. Thus, the higher the magnetic field the better the NMR spectrometer. Over the years this has led to the development of spectrometers of ever increasing magnetic fields. Superconducting magnets can be built with much higher fields than the usual electromagnets. Thus most NMR spectrometers used incorporate superconducting magnets. Although most of the elements in the Periodic Table have an isotope that is magnetic, the most common nucleus to be observed by NMR is that of hydrogen. This has led to the common use of the hydrogen resonant frequency for a given NMR spectrometer as a measure of the magnetic field strength of that spectrometer. NMR spectrometers that use permanent or electromagnets range from 60 MHz up to 100 MHz, while spectrometers with superconducting magnets range from 200 MHz to many hundred megacycles.
Data Analysis
In a hydrogen NMR spectrum, the presence of any resonance explains first that the molecule of study contains hydrogen. Second, the number of bands in the spectrum shows how many different positions there are on the molecule to which hydrogen is attached. The frequency of a particular resonance in the NMR spectrum is referred to as the chemical shift. This is the most important measurable part of the NMR spectrum and contains information about the environment of each hydrogen atom and the structure of the compound under study. The third bit of information that an NMR spectrum provides is the ratio of the areas of the different bands, thus explaining the relative number of hydrogen atoms that exist at each position on a given molecule. This ratio is direct evidence of the structure of molecular structure and must correspond absolutely to any proposed structure before that structure may be considered correct.
Finally, the complex structure of the bands may contain information about the distance that separate the various hydrogen atoms through covalent bonds and the spatial arrangement of the hydrogen atoms attached to the molecule, including secondary structure. Secondary structure refers to folding or self-assembly of a molecule due to long-range bonding, such as in the spiral structure of DNA. The complex structure of the NMR bands is due primarily to spin coupling between the various hydrogen atoms. This coupling is, in turn, a function of the distance through the bonds and the geometry of the molecule. In the case of small molecules, the band complexity may be simulated exactly with quantum mechanical calculations or approximated using quantum mechanically derived rules.
Fundamental to the use of NMR is the ready correlation of measurable spectrum quantities with the structure of a molecule under study. Consider the simple molecule ethanol. Ethanol has three bands in its hydrogen NMR spectrum that correlate with the three distinct types of hydrogen atoms present in the molecule. The area ratio of the three bands is 1:2:3 and this reflects the number ratio of the hydrogen atoms seen in the structure of
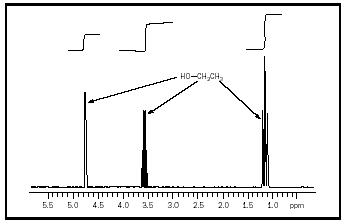
ethanol. The fine structure of the bands in this spectrum may also be correlated with the structure of ethanol using simple rules. As more complex molecules are considered, more complex rules must be used until finally two-dimensional NMR (2D NMR) and even more complex spectroscopic procedures must be used for complete analysis.
Discovery
Although NMR was thought to be possible for many years, it was first demonstrated in 1946 simultaneously and independently by two physicists working on the East Coast and the West Coast of the United States: Felix Bloch at Stanford University and Edward Mills Purcell at Harvard University. For their work they shared the Nobel Prize in physics in 1952. The first commercial spectrometers appeared later in the 1950s and quickly became an indispensable tool for research chemists. The first commercial spectrometers were based on conventional electromagnets and permanent magnets, but during the 1960s the superconducting magnetic had already been largely adopted. In 1966 the chemist Richard Ernst demonstrated Fourier transform nuclear magnetic resonance (FT NMR). This procedure quickly replaced the older scanning techniques and earned Ernst the Nobel Prize in chemistry in 1991. He continued to make contributions to many areas of NMR but most notable are his contributions to 2D NMR and magnetic resonance imaging (MRI).
Magnetic Resonance Imaging
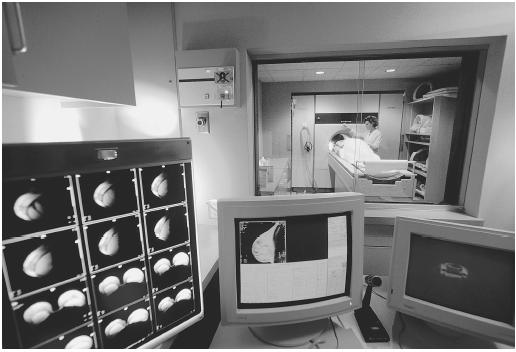
Magnetic resonance imaging (MRI) is a spin-off of NMR. The two techniques differ in two important respects. First, in NMR spectrums the individual resonance bands of different frequency are displayed in a spectrum to reveal structural and purity information while in MRI all of the resonance bands are grouped together as a single quantity. Second, in NMR the magnetic field is very homogeneous so that the different frequency bands may be clearly separated; however, with MRI a linear magnetic gradient is superimposed on the main magnetic field so that the frequency of the NMR signal is a function of space instead of structure. The gradient is alternated along different axes so that an image may be constructed. The resulting image is a two-dimensional slice through the sample. Several slices may be accumulated so that a three-dimensional image may then be constructed if needed. Since the 1980s, MRI has grown to be an indispensable tool in the medical diagnosis of many maladies—especially of soft tissue, such as the brain and the spine. In an MRI body scan, the image is constructed primarily from the detected radiation of the hydrogen atoms in water and lipids of the various tissues. While the varying concentration of water and lipids in various tissues contribute to the formation of an MRI image, the dominant factor is the variation in the length of time that the hydrogen atoms found in different tissues will radiate. This difference in radiation time is referred to as relaxation time. Contrast, and thus good images, may be achieved by delaying the onset of radio-frequency detection until some tissues have almost quit radiating while other tissues are still radiating strongly. Particularly noteworthy is the difference in relaxation time of normal tissue compared to malignant tissue. MRI may be optimized best for imaging specific tissues using a combination of radio-frequency pulse parameters, delay times, and magnetic gradients. These same parameters may be used to measure the flow of fluids through tissues, such as the flow of blood through muscle tissue. The contrast and thus the quality of the MRI for some specific tissues may be significantly increased by the use of specially engineered compounds called MRI contrast reagents . These compounds have two required properties: They must associate specifically with a tissue under investigation and they must be magnetic. The presence of a contrast reagent in a tissue changes the relaxation time of the water in this tissue in such a way that the MRI image is enhanced.
SEE ALSO Molecular Structure ; Organic Chemistry ; Spectroscopy .
Ben Shoulders
Bibliography
Bloch, F.; Hansen, W. W.; and Packard, M. (1946). "The Nuclear Induction Experiment." Physics Review 70:474.
Pound, R. V., and Purcell, E. M. (1946). "Measurement of Magnetic Resonance Absorption by Nuclear Moments in a Solid." Physics Review 70:980.
Comment about this article, ask questions, or add new information about this topic: